Dan Nadler

DataSpace

When I first heard about the Oculus Rift, I was excited about the opportunity VR would bring to data visualization. We would no longer be bound to keyboard and mouse, or to the 2D plane of a monitor. We would occupy the same space as our creations and truly interact with anything we could imagine.

I can plot 3D charts on a monitor with no problem, but keeping track of the patterns I see can be challenging sometimes, especially when incorporating higher dimensions via attributes like color or size. With all of the VR development resources, I figured that it would be relatively simple to implement a useful data visualization application. I waited patiently for the first app to appear, but alas, it never came. Most data visualizations were no more than a 2D chart floating in a virtual room, or a line-chart turned into a roller-coaster. Fun to look at, sure, but far from useful. No one was really thinking about these applications as tools, but as “experiences” or entertainment. The one application that seemed to be intended for scientific use was very buggy and difficult to use.

That’s why I built DataSpace. It’s the only hardcore data visualization app for modern virtual reality headsets that I am aware of (though I haven’t looked too hard since I started building DataSpace). Bear in mind that this was my first real foray into Unity/C# and game development in general. There are a lot of rough edges. For example, the UI/UX should really be reworked, but it’s also the part that I am least interested in working on.

At the moment, my app only allows for the creation of a 3-dimensional scatter plot. The user can map data from a CSV file to the three spatial dimensions, one color dimension (a red-green gradient), and a time dimension.

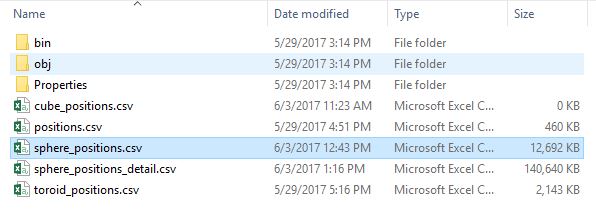
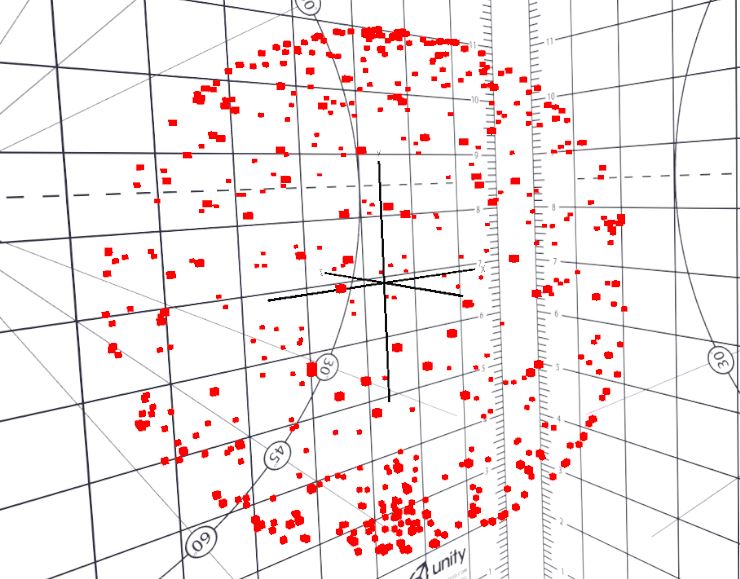
In this blog post, I use an n-body simulation (github repo) as an example. I ran a simulation with 500 bodies of equal mass and radius at psuedo-random points along the outside of a sphere. The bodies interact using Newtonian gravity, and merge if the bodies touch. This isn’t a 100% physically accurate simulation, just something I did for fun that turned out to be useful as an example.

The simulation outputs a CSV file with columns for the position, mass, time, and body ID. Each row represents the mass and location of a specific body at a specific time. This output file is about 12.5 MB (about 192,000 rows). I initially ran into issues drawing this much data, but I was able to use some video game optimization techniques to make it run quite smoothly. At this point, the only real bottleneck is the load time when I have to redraw the entire plot (for example, when I reassign axes or initialize the scatter plot room).

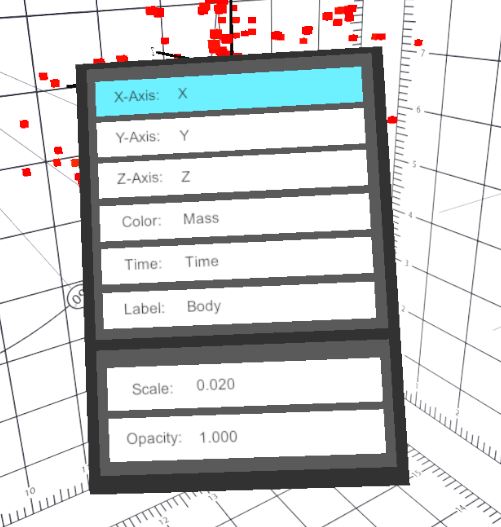
Here’s the loader menu (you’ll notice that I’m running this in the Unity editor, but I have an alpha version on Oculus Home as well):

file_select

csv_loader

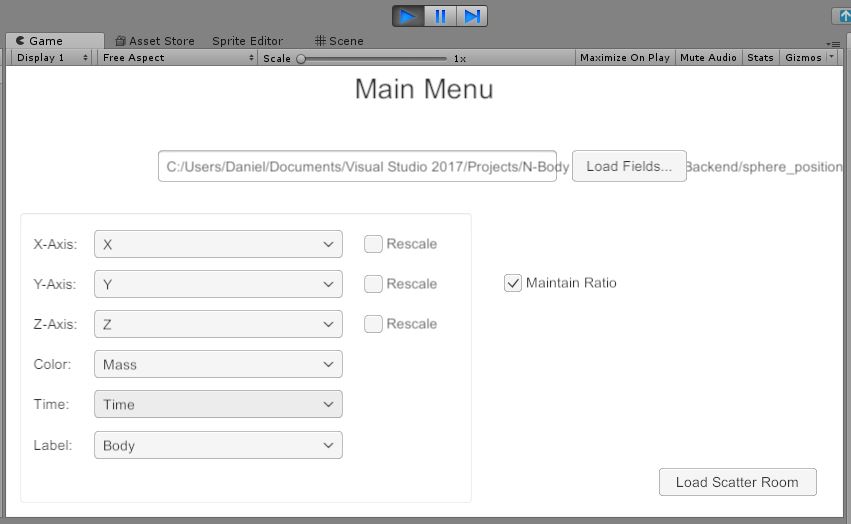
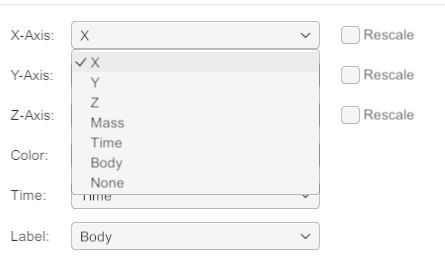
The menu provides a default mapping, but you can specify the initial mapping however you want. You can also change this on-the-fly once you’re in the scatter plot room.

axis_select

Click “Load Scatter Room,” and voila:

sphere_loaded

Once you’re in the scatter plot room, you can access an in-game menu that appears over the left controller. You can manipulate the menu with the left joystick, toggle the menu visibility with “Y”, and redraw the data with “A”. Holding down the left trigger will let you access the Scale and Opacity variables:

left_hand_menu

A smaller version of the axes appears over the right controller for reference (toggle with “B”). They rotate with the main axes, but do not scale or stretch.:

right_hand_axis

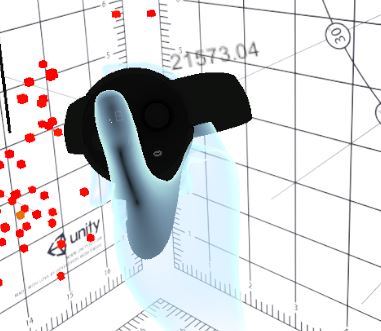
You can scroll through the time variable with the right joystick (squeeze the right trigger to go faster):

The current time variable is displayed above the right hand:

right_hand_time_index

There are a couple other major features that I demonstrate in the video at the top of this post, including:

  • Moving and resizing the plot by grabbing it
  • Identifying data items by pointing at them (click the joystick to enable the laser pointer, then use your index finger to point at the data)

Some things I’d like to add/improve in the future are:

  • Better UI & UX, including more intuitive menus
  • Basic statistical tools
    • Regression
    • Clustering
  • Annotations
    • Draw, highlight, and label
    • Take screenshots while wearing the headset
  • Save and load

Do you have a use case for something like this? Let me know; I’m really interested to see if anyone else would find this useful. I’ve mostly used it for fun visualizations, but I did find it fairly helpful for quickly exploring a dataset from the Two Sigma Kaggle competition.

If you’re interested in trying it out, please feel free to shoot me an email. The app only supports the Rift at the moment, and you will need Oculus Home to download the application.

A Quick Note on Services

I recently ran into an issue where my master control process was crashing. I haven’t yet figured out the root cause, but it runs fine for 12-24 hours before crashing. After crashing, I have been able to restart the process without issue. As a stop-gap measure, I decided to set up the process to automatically restart in the event of a crash…

Controlling the Thermostat, and Better Reliability

This past week I spent some time improving the reliability of the thermostat, and also working on a way to set the temperature without having to SSH into the Pi.

An Interface for the Thermostat

I decided to embed a small Flask application inside the thermo package in order to create a simple web-based UI. This would allow me to control the thermostat from a screen attached to the Pi itself, and also through any other device on my local network. I could theoretically port-forward the application so that I could access it from outside my local network, but I will need to add some security before doing something like that.

The first step was to sketch out a plan for the UI. I came up with this simple interface after a few iterations. This is just the ‘main menu,’ I haven’t designed the other pages yet.

sketch

My Flask application is laid out so that it generally calls a function from an API file. The functions in the API file reach out to other modules within thermo or go straight to the database to insert or update a record.

A Better Multi-Sensor Schematic

I just wanted to make a quick post with a better way to do the multi-sensor setup that I am using. Previously, I had posted a schematic and pictures where I was using one resistor per sensor. After thinking about this a little bit, I realized that this is completely unnecessary, and that you only need one resistor per circuit:

A Better Multi-Sensor Schematic feature image

Of Relays and Thermostats

This weekend I decided to take the leap and add thermostat functionality to my setup.

  1. Connect a Pi to furnace
  2. Write the software to control the furnace

Connecting to the Furnace

This was actually relatively straightforward. My thermostat is connected to the furnace via two wires. When the thermostat completes the circuit, the furnace turns on. When it breaks the circuit, the furnace turns off. There’s a little nuance here, as I imagine the details can vary from furnace to furnace. For example, my furnace has a variable blower, but I don’t have enough wires connected to my thermostat to dynamically control it, I can only turn it on and off. I’ll address this limitation in the future.

Of Relays and Thermostats feature image

thermoDashboard

I got tired of constantly querying my database to see the current status of my house, so I decided to build a simple dashboard.

I chose to use Zappa and Flask to display some simple Highcharts graphs on a webpage. The database is still hosted at Google, which isn’t ideal for this setup. I do like the Google Cloud interface, and the SQL service they have is easy to use with auto-scaling. I’ll have to weigh my options and decide if it’s worth the move to AWS.

Multiple Sensors

I wanted to go back and write a little about how I am using multiple sensors for this project. I learned early on that the DS18B20 thermal sensors I am using can be chained together very easily, as illustrated here:

schematic

The result is that one GPIO pin can receive data from a number of sensors (not sure of any limit). The sensors each appear in /sys/bus/w1/devices/ as folders named by their serial numbers.

I decided to solder the resistor to the sensor, rather than hook up everything through a breadboard. This probably isn’t a great long-term solution, but it allows me to easily move sensors around.

The sensors aren’t labeled, as far as I could tell, so I had to figure out the serial numbers and keep track of everything myself.

Analyzing the Data, II

Multiple Sensors

Since my last post, I’ve installed multiple sensors and expanded my code (on github) to read and store the data. I’ve also set up a MySQL server on Google Cloud to store the data.

I’ll describe the hardware setup in another post, but what I’m really excited about is the data I’m able to collect now.

In this chart, I start with two sensors, and have 4 sensors running by the end of the period. Three interior, and one exterior:

The grey line (exterior), is aligned with the right axis.

one_day

Analyzing the Data

Finally, we’re on to the good stuff!

I left the Pi to collect data for a little while, and this is what I had when I came back the next day.

df['Living Room (North Wall)'].head(10)
record_time
2017-01-21 18:16:22 65.8616
2017-01-21 18:16:33 65.8616
2017-01-21 18:16:45 65.8616
2017-01-21 18:59:37 66.2000
2017-01-21 18:59:49 66.2000
2017-01-21 19:00:01 66.2000
2017-01-21 19:00:13 66.2000
2017-01-21 19:00:24 66.2000
2017-01-21 19:00:36 66.2000
2017-01-21 19:00:48 66.2000
Name: Living Room (North Wall), dtype: float64

WOOHOO!

Collecting Data

Reading the Sensor

As a reminder, the sensors write to files located here: /sys/bus/w1/devices/<DEVICE-ID>/w1_slave, and they look something like this:

24 01 4b 46 7f ff 0c 10 48 : crc=48 YES
24 01 4b 46 7f ff 0c 10 48 t=18250

The t=18250 is the temperature (this would be 18.25 degrees celsius, and crc=48 YES shows that the sensor is functioning properly. If it was not, it would say NO.

It’s pretty simple to read this file… here’s the function I wrote to do it:

Setting up the Pi

Parts

I ordered my first set of parts from Amazon, here’s what I got:

  1. Raspberry Pi 3 Model B Motherboard ($40)
  2. 5pcs DS18B20 Temperature Sensors ($12)
  3. 5V 2.5A Power Supply ($10)
  4. Electronics Starter Kit with Breadboard ($13)
  5. GPIO T-Cobbler with Ribbon Cable ($10)
  6. A 16GB MicroSD card that I had lying around

To be fair, I didn’t do a whole lot of research before buying these parts, and probably could have found some of them cheaper elsewhere. The parts that came with the Elegoo kit were okay, but I am mostly just using the cables and breadboard. The breadboard is fairly small, which made working with the cobbler a little difficult. I ended up connecting the Pi directly to the breadboard without the cobbler, and have ordered a large breadboard as well.

Welcome to my Raspberry Pi Thermostat project!

Welcome to my Raspberry Pi Thermostat project!

I’ve been looking for a new project to learn from, and decided to work with the Raspberry Pi. I have a decent programming background, but not much knowledge of the hardware end. I’m going to use this blog to track my progress as I learn the necessary skills to create a thermostat and data collection tool for my house.

My goals for this project are as follows:

  1. Create a device capable of recording and save the temperature of at lest 5 rooms.
  2. Also consider recording data from the exterior of the building.
  3. Save the data and use it to improve my heating efficiency via one-off improvements to things like the thermostat schedule, airflow redirection, etc.
  4. Create and connect automated devices that increase my comfort while minimizing energy usage.

These goals aren’t set in stone, but I will try to stick to them as I go, and justify any changes to the scope of the project that I do make.